Sort by:
View:
https://blog.mehedy.com/wp-content/uploads/2024/03/RPC-960x696_c.webp

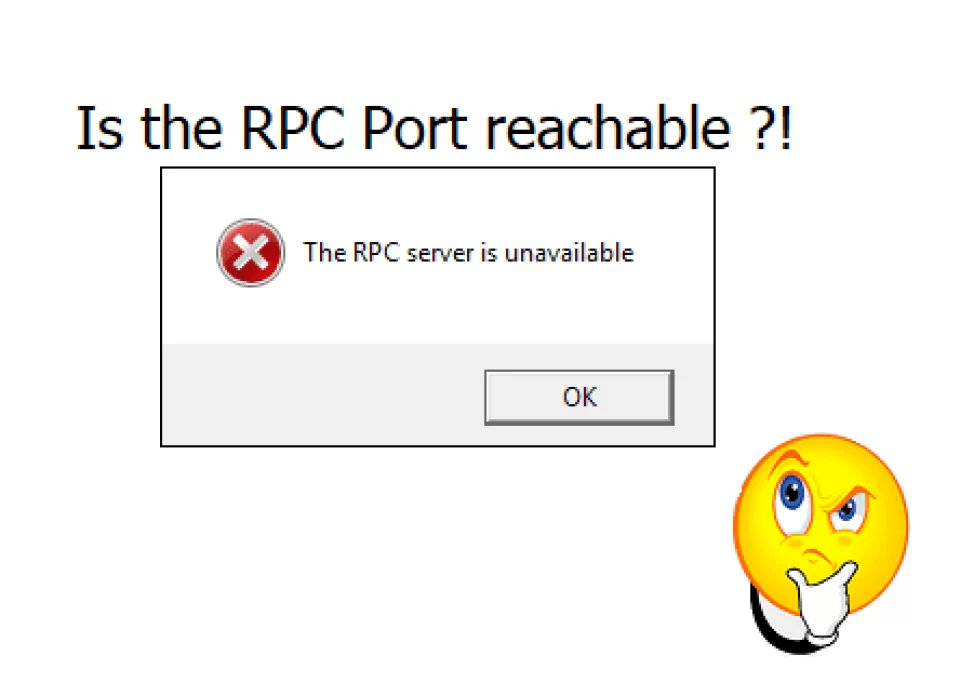
Simplifying RPC Testing with PowerShell Scripts: A Step-by-Step Guide


Welcome to our comprehensive guide on Simplifying RPC Testing with PowerShell effectively. PowerShell scripts are powerful tools for managing server infrastructure efficiently. In this tutorial, we’ll delve into the intricacies of RPC (Remote Procedure Call) scripts, exploring how to automate server tasks seamlessly.

In today’s dynamic IT landscape, ensuring the seamless functioning of Remote Procedure Call (RPC) services is paramount. However, manually testing RPC connections across various ports can be time-consuming and prone to errors. Fortunately, PowerShell scripts offer a robust solution to automate this process, allowing IT professionals to conduct thorough Simplifying RPC Testing effortlessly.

Unlocking the Potential of PowerShell RPC Scripts

Here, we present two PowerShell scripts – Start-RpcServices.ps1 and Test-RpcPorts.ps1 – designed to streamline RPC testing. Let’s delve into each script’s functionality and how to effectively utilize them.

Start-RpcServices.ps1

This script initiates RPC services on random ports and sends the generated port list to a testing server for verification.

Script Explanation:

  1. Test-ServerReachability Function: Checks the reachability of the testing server using Test-Connection cmdlet.
  2. Prompt for Testing Server Hostname: Prompts the user to enter the hostname of the testing server until a reachable server is provided.
  3. Prompt for Number of Random Ports: Prompts the user to enter the number of random ports to generate within the valid range (1 to 65535).
  4. Start RPC Services: Initiates RPC listeners on random ports and displays the port numbers.
  5. Send Port List to Testing Server: Saves the generated port list and hostname to the testing server’s share path.
  6. Stop RPC Services: Waits for a keystroke to stop the RPC services and closes the listeners.

How to Use the Script:

  1. Run the script.
  2. Enter the hostname of the testing server.
  3. Specify the number of random ports to generate.
  4. Press any key to stop the RPC services once testing is complete.

Test-RpcPorts.ps1

This script tests RPC connections on the specified ports against the testing server.

Script Explanation:

  1. Read Hostname and Ports: Retrieves the hostname and random ports from the testing server’s share path.
  2. Test RPC Connection: Attempts to establish RPC connections on each port and displays the connection status.

How to Use the Script:

  1. Run the script.
  2. Ensure the hostname and port list files are available in the specified share path.
  3. The script will automatically test RPC connections and display the results.

By leveraging these PowerShell scripts, IT professionals can efficiently validate RPC services, enhancing network reliability and minimizing downtime.

Now, let’s make RPC testing a breeze with the provided scripts:

Start-RpcServices.ps1:

# Start-RpcServices.ps1

# Function to test reachability of the server
function Test-ServerReachability {
param([string]$serverName)
$pingResult = Test-Connection -ComputerName $serverName -Count 1 -Quiet
return $pingResult
}

# Prompt for the testing server hostname
do {
$testingServerHostname = Read-Host "Enter the hostname of the testing server"
$serverReachable = Test-ServerReachability -serverName $testingServerHostname

if (-not $serverReachable) {
Write-Host "Server '$testingServerHostname' is not reachable. Please provide a reachable server."
}
} until ($serverReachable)

# Prompt for the number of random ports
do {
$portCount = Read-Host "Enter the number of random ports to generate (between 1 and 65535)"
if (-not ($portCount -as [int])) {
Write-Host "Please enter a valid number."
continue
}
if ($portCount -lt 1 -or $portCount -gt 65535) {
Write-Host "Please enter a number between 1 and 65535."
}
} until ($portCount -as [int] -ge 1 -and $portCount -as [int] -le 65535)

# Start RPC services on dynamic ports
$rpcDynamicPortRange = 49152..65535

# Select random ports based on user input
$randomPorts = Get-Random -InputObject $rpcDynamicPortRange -Count $portCount

# Start RPC listeners on each random port
$rpcListeners = @{}
foreach ($port in $randomPorts) {
$rpcListener = [System.Net.Sockets.TcpListener]::new([System.Net.IPAddress]::Any, $port)
$rpcListener.Start()
$rpcListeners[$port] = $rpcListener
Write-Host "RPC service started on port $port"
}

# Send the list of generated ports to Testing Server's C$ share path
$randomPorts | Out-File -FilePath "\\$testingServerHostname\C$\RandomPorts.txt" -Force

# Save the hostname to the Testing Server's C$ share path
$hostname = hostname
$filePath = "\\$testingServerHostname\C$\Hostname.txt"
$hostname | Out-File -FilePath $filePath -Force

# Wait for a keystroke to stop the RPC services
Write-Host "Press any key to stop the RPC services..."
$null = $Host.UI.RawUI.ReadKey("NoEcho,IncludeKeyDown")

# Close the listeners
foreach ($rpcListener in $rpcListeners.Values) {
$rpcListener.Stop()
Write-Host "RPC service stopped on port $($rpcListener.LocalEndpoint.Port)"
}
Write-Host "All RPC services stopped"

Test-RpcPorts.ps1:

# Test-RpcPorts.ps1

# Read the hostname of the testing server from the C$ share path
$filePath1 = "C$\Hostname.txt"
$ServerName = Get-Content -Path "\\$env:COMPUTERNAME\$filePath1"
$targetServer = $ServerName

# Read the Ports to check from the C$ share path
$filePath2 = "C$\RandomPorts.txt"
$randomPorts = Get-Content -Path "\\$env:COMPUTERNAME\$filePath2"

# Test RPC connection for each random port
foreach ($port in $randomPorts) {
    try {
        $client = New-Object System.Net.Sockets.TcpClient($targetServer, $port)
        $client.Close()
        Write-Host "RPC connection successful to $targetServer on port $port"
    } catch {
        Write-Host "RPC connection failed to $targetServer on port $port"
    }
}

Empower your IT infrastructure with streamlined RPC testing using PowerShell automation. Say goodbye to manual testing hassles and embrace efficiency in network management.

Ready to simplify RPC testing? Execute these scripts and experience the difference firsthand!

https://blog.mehedy.com/wp-content/uploads/2018/06/Brute-Force-Attacks-960x639_c.jpg

Protect Exchange OWA from Brute-Force attack


Protecting Exchange OWA from any Brute-Force attack follow the below steps.

Step1: Maintain Password Policy from Active Directory Domain Controller

To protect the OWA from Brute-Force attack we can proceed with simple things. First, we need to manage the password policy on our Active Directory.

Protect Exchange OWA from Brute-Force attack

To get manage this policy, we can simply configure it from the Group Policy. Selecting the password policy GPO.

Step 2: Configure the cache for IIS authentication

Once the Password Policy has been maintained the next step is to configure the cache for IIS authentication. As I have mentioned earlier, even though user is locked on Active Directory they will still get access on the OWA Portal. So to stop it, we need to reduce the cache of the IIS website. To reduce the cache we need to perform below action.

  1. Open Regedit on Exchange CAS server.
  2. Go to HKLM\SYSTEM\CurrentControlSET\Services\InetInfo\Parameters
  3. Create a new DWORD with name UserTokenTTL and keep the value 30 ( this means keeping the Cache only for 30 Sec).

    Protect Exchange OWA from Brute-Force attack

Now, if the user enters few number of wrong password. Then user will not be able to login into their OWA or get authenticate until account is unlocked by administrator.

Hope this will help you to protect from the Brute-force attack.

https://blog.mehedy.com/wp-content/uploads/2017/09/image_thumb5-960x675_c.png

EXCHANGE 2013/2016 RECREATE ARBITRATION MAILBOXES


In most cases while we try to migrate exchange or install another instance of exchange or for many misc reasons the Arbitration Mailboxes gets corrupted, or damaged. For which we are unable to install exchange getting various errors. In that cases we require to recreate Arbitration Mailboxes.

ARBITRATION MAILBOXES ERROR

ARBITRATION MAILBOXES ERROR

In this article, I will show you how we can do just that in Exchange 2013 or 2016.

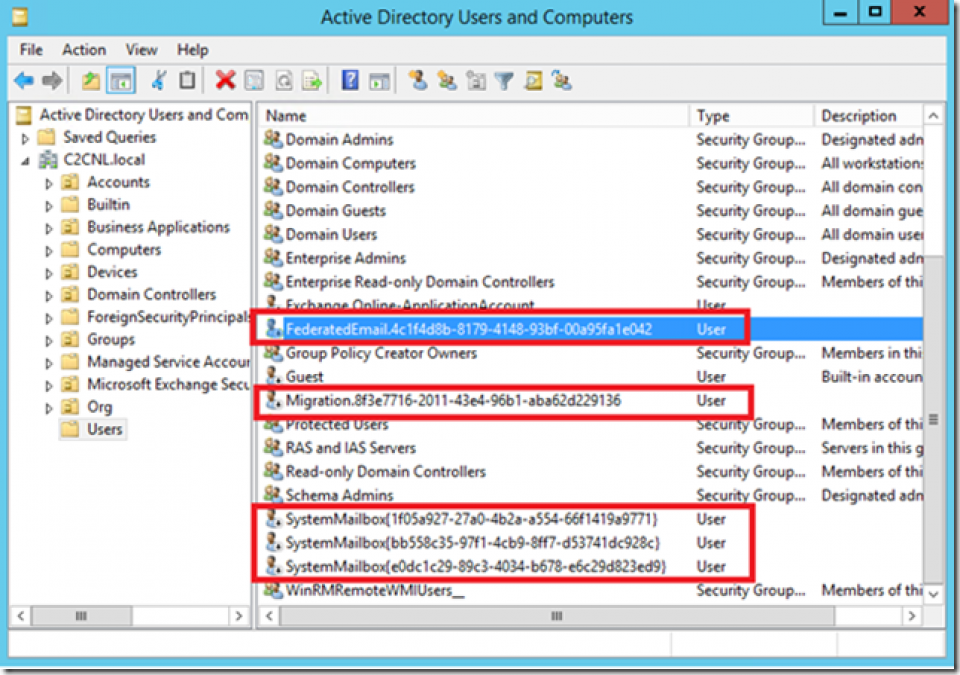
To recreate the Arbitration Mailboxes we first have to remove everything the accompanying user accounts, which can be found in CN=Users in Active Directory:

Delete Corrupted Arbitration Mailboxes

Delete Corrupted Arbitration Mailboxes

When the user accounts are deleted you can run the Get-Mailbox –Arbitration command again to see if they are really removed.

Once removed, you have to run the Setup.exe /PrepareAD /IAcceptExchangeServerLicenseTerms command again (from the correct installation media by the way) to recreate the Arbitration Mailboxes:

PrepareAD Command

PrepareAD Command

The user accounts are now created again, and the next step is to Mail-Enable them:

Enable-Mailbox –Arbitration –Identity "FederatedEmail.4c1f4d8b-8179-4148-93bf-00a95fa1e042"

Enable-Mailbox –Arbitration –Identity "SystemMailbox{1f05a927-8668-4003-adad-9b80758e86db}"

Enable-Mailbox –Arbitration –Identity "SystemMailbox{e0dc1c29-89c3-4034-b678-e6c29d823ed9}"

Enable-Mailbox –Arbitration –Identity "SystemMailbox{bb558c35-97f1-4cb9-8ff7-d53741dc928c}"

To prevent typos you can also use the following command:

Get-User | Where {$_.Name –like "SystemMailbox*"} | Enable-Mailbox -Arbitration

Get-User | Where {$_.Name –like "FederatedEmail*"} | Enable-Mailbox –Arbitration


Enable Arbitration Mailboxes

Enable Arbitration Mailboxes

The federation Arbitration Mailbox needs to have a 1MB quota limit set to it, this can be achieved using the following command:

Get-Mailbox –Arbitration –Identity "FederatedEmail*"} | Set-Mailbox –Arbitration –ProhibitSendQuota 1MB

Set federation Arbitration Mailbox Quota

Set federation Arbitration Mailbox Quota

The Arbitration Mailboxes are up and running again, you can check using the Get-Mailbox –Arbitration command:

image


https://blog.mehedy.com/wp-content/uploads/2017/07/1490026787_windows-10-creators-update-final-isos-960x540_c.jpg

Windows 10 Enterprise 1703 Evaluation Available For Download


Head on over to the TechNet Evaluation Center to grab the following ISOs for Windows 10 1703.

windows 10

windows-10-creators-update

Windows 10 Enterprise, version 1703 | 64-bit ISO
Windows 10 Enterprise, version 1703 | 32-bit ISO
Windows 10 Enterprise is designed to address the needs of large and midsize organizations by providing IT professionals with:

  • Advanced protection against modern security threats
  • Flexible deployment, update, and support options
  • Comprehensive device and app management and control

Windows 10, version 1703 (also referred to as the Windows 10 Creators Update) offers new security capabilities to help IT administrations better protect against, and respond to, threats on networks and devices as well as modern IT tools to streamline the management of devices, applications, and updates.

Looking for information on specific features? See what’s new in Windows 10.


Languages

English (United States), English (Great Britain), Chinese (Simplified), Chinese (Traditional), French, German, Italian, Japanese, Korean, Spanish, Portuguese (Brazil)

Preinstall Information

Note: Carefully read the information below before you continue with the download.

  1. Review the Windows 10 Enterprise system requirements.
  2. Register, then download and install the full-featured software for a 90-day evaluation.
  3. Receive emails with resources to guide you through your evaluation.

Installation Guidelines

  • Plan ahead. Back up your files and settings before installing this evaluation.
  • Upon installation, Windows will prompt you to activate. A product key is not required for this software.
  • In order to use Windows 10 Enterprise, you must sign in to your PC with a Microsoft account. The option to create a local account will be made available at the time of the final release.
  • If you decide that you want to install Windows 10 Enterprise using one of the provided ISO files, you won’t be able to uninstall it. In addition, after you install Windows 10 Enterprise, you won’t be able to use the recovery partition on your PC to go back to your previous version of Windows. A clean installation of your former operating system will be required, and you will need to re-install all of your programs and data.
  • If you fail to activate this evaluation after installation, or if your evaluation period expires, the desktop background will turn black, you will see a persistent desktop notification indicating that the system is not genuine, and the PC will shut down every hour.

Product Key

Upon installation, Windows will prompt you to activate. A product key is not required for this software. For recovery scenarios, the following key may be used: VTNMT-2FMYP-QCY43-QR9VK-WTVCK

Things to Know

This is evaluation software that is designed for IT professionals interested in trying Windows 10 Enterprise on behalf of their organization. We do not recommend that you install this evaluation if you are not an IT professional or are not professionally managing corporate networks or devices.

Windows 10 Enterprise should work with the same devices and programs that work with Windows 8.1. In some cases, a device or program might not work or may require an update, or you might need to uninstall some programs and then reinstall them after installing the evaluation.

Downloading Windows 10 Enterprise could take a few hours. The exact time will depend on your provider, bandwidth, and traffic (ISP fees may apply).

To install a 64-bit OS on a 64-bit PC, your processor needs to support CMPXCHG16b, PrefetchW, and LAHF/SAHF.

BitLocker requires either Trusted Platform Module (TPM) 1.2, TPM 2.0 or a USB flash drive. Client Hyper-V requires a 64-bit system with second level address translation (SLAT) capabilities and additional 2 GB of RAM. Windows Hello requires specialized illuminated infrared camera for facial recognition or iris detection or a finger print reader which supports the Window Biometric Framework. Two factor authentication requires the use of a PIN, Biometric (finger print reader or illuminated infrared camera), or a phone with Wi-Fi or Bluetooth capabilities. Windows To Go requires advanced hardware. To learn more about USB drives certified for Windows To Go, please visit www.microsoft.com/WindowsToGo.

For the latest information on deprecated features and additional requirements to use certain features, please see Windows 10 Specifications. For technical questions, please visit the Windows 10 TechNet forums.

Collected ..

https://blog.mehedy.com/wp-content/uploads/2017/06/Figure-1-Sorebrect-fileless-ransomware-960x225_c.jpg

New Code-injecting SOREBRECT Fileless Ransomware detected


Security researchers have recently discovered a new fileless ransomware, dubbed “Sorebrect,” which injects malicious code into a legitimate system process (svchost.exe) on a targeted system and then self-destruct itself in order to evade detection.

Sorebrect fileless ransomware

Sorebrect fileless ransomware

While new forms of cybercrime are on the rise, traditional activities seem to be shifting towards more clandestine techniques that come with limitless attack vectors with low detection rates.

It is no secret that hackers and cybercriminals are becoming dramatically more adept, innovative, and stealthy with each passing day.

Unlike traditional ransomware, Sorebrect has been designed to target enterprise’s servers and endpoint. The injected code then initiates the file encryption process on the local machine and connected network shares.

This fileless ransomware first compromises administrator credentials by brute forcing or some other means and then uses Microsoft’s Sysinternals PsExec command-line utility to encrypt files.

“PsExec can enable attackers to run remotely executed commands, instead of providing and using an entire interactive login session, or manually transferring the malware into a remote machine, like in RDPs,” .

Sorebrect Also Encrypts Network Shares

Sorebrect also scans the local network for other connected computers with open shares and locks files available on them as well.

“If the share has been set up such that anyone connected to it has read-and-write access to it, the share will also be encrypted,” researchers say.

The nasty ransomware then deletes all event logs (using wevtutil.exe) and shadow copies (using vssadmin) on the infected machine that could provide forensic evidence such as files executed on the system and their timestamps, which makes this threat hard-to-detect.

In addition, Sorebrect uses the Tor network protocol in an attempt to anonymize its communication with its command-and-control (C&C) server, just like almost every other malware.

Sorebrect Ransomware Spreads Worldwide

The Sorebrect fileless ransomware has been designed to target systems from various industries including manufacturing, technology, and telecommunications.

According to Trend Micro, Sorebrect was initially targeting Middle Eastern countries like Kuwait and Lebanon, but from last month, this threat has started infecting people in Canada, China, Croatia, Italy, Japan, Mexico, Russia, Taiwan, and the U.S.

“Given ransomware’s potential impact and profitability, it wouldn’t be a surprise if SOREBRECT turns up in other parts of the world, or even in the cybercriminal underground where it can be peddled as a service,” the researchers note.

SOREBRECT’s code injection makes it a fileless threat

SOREBRECT’s attack chain involves the abuse of PsExec, a legitimate, Windows command-line utility that lets system administrators execute commands or run executable files on remote systems. The misuse of PsExec to install SOREBRECT indicates that administrator credentials have already been compromised, or remote machines were exposed or brute-forced. SOREBRECT isn’t the first family to misuse PsExec—SAMSAM, Petya, and its derivative, PetrWrap (RANSOM_SAMSAM and RANSOM_PETYA, respectively), for instance, use PsExec to install the ransomware on compromised servers or endpoints.

SOREBRECT takes this a notch further by maliciously deploying PsExec and performing code injection. It injects its code into Windows’ svchost.exe process, while the main binary self-destructs. The combination is potent: once the deployed ransomware binary finishes execution and self-termination, the injected svchost.exe—a legitimate Windows service-hosting system process—resumes the execution of the payload (file encryption). Because SOREBRECT becomes fileless after code injection, sourcing its binary sample at the endpoint level is challenging.

Why PsExec? While attackers can both use Remote Desktop Protocol (RDP) and PsExec to install SOREBRECT in the affected machine, its code injection capability makes the attack more effective. Compared to using RDP, utilizing PsExec is simpler and can take advantage of SOREBRECT’s fileless and code injection capabilities. PsExec can enable attackers to run remotely executed commands, instead of providing and using an entire interactive log-in session, or manually transferring the malware into a remote machine, like in RDPs. In SOREBRECT’s case, it makes more sense for the attackers to use PsExec since once the main binary is executed, the svchost.exe process injected with malicious code can still carry out the payload.

To cover its tracks, SOREBRECT also utilizes wevtutil.exe to delete the system’s event logs, and vssadmin to delete shadow copies. The svhost.exe process that was injected with malicious code executes the payload—encrypting the files of the local machine and network shares. SOREBRECT uses the Tor network protocol to anonymize its connection to its command-and-control (C&C) server.

New Code-injecting SOREBRECT Fileless Ransomware detected
SOREBRECT appends encrypted files with a .pr0tect extension

New Code-injecting SOREBRECT Fileless Ransomware detected

One of SOREBRECT’s ransom notes

Ways to Protect Against Ransomware Attacks

Since the ransomware does not target individuals but organizations, sysadmins and information security professionals can protect themselves by:

  • Restricting user write permissions: a significant factor that exposes network shares to ransomware by giving users full permissions. By using Active Directory Group Policy Software Restriction settings this can be achieved.
  • Limiting privilege for PsExec: Limit PsExec and provide permission to run them only to system administrators. Blocking TCP ports 135 & 445 for external network and Disabling Admin$ and IPC$ shares might just do the trick.
  • Keeping your system and network up-to-date: Always keep your operating system, software, and other applications updated. Microsoft’s System Center Configuration Manager [SCCM] might be a very handy Solutions for this.
  • Backing up your data regularly: To always have a tight grip on all your important files and documents, keep a good backup routine in place that makes their copies to an external storage device that is not always connected to your PC. AS per my personal choice Synology NAS Solution can give you a nice boost and it is cheap also.
  • Adopting a cyber security-aware workforce: Educating your employees about malware, threat vectors and security measure always plays a major role in any organization.
https://blog.mehedy.com/wp-content/uploads/2017/04/image007-960x745_c.png

Why Increase MAX Worker Threads of SQL Server ?


When Should We Increase The Max Worker Threads?

Why will we Increase MAX Worker Threads ? When all are active with long running queries, SQL Server might appear unresponsive until a worker thread completes and becomes available.

If SQL Server reaches its maximum capacity of 960 threads [for 32 processors / settings default value to 0] and does not take any more connections as it has run out of worker threads SQL Server may seem unresponsive.

It is not a defect of SQL Server but to improve SQL server performance. One should consider using Indexes in SQL Query which is running, or measure the Query cost and improve index or query being executed.

If nothing can be done from the application or query end, you can manually set the worker thread to a larger number, but it will significantly slow down your SQL Server, as now it will use Worker Thread more than your CPU can handle. Or you might consider adding processor resources to your Server.

Use Below Tsql To Monitor And Set Max Worker Threads As Per Your Requirement.

USE master; //choose the database you want to set max worker threads for. master database will set it at instance level.
GO
EXEC sp_configure 'show advanced option'//shows the current value of the advanced options
GO
EXEC sp_configure 'show advanced option', '1'; //enables the advanced options
GO
RECONFIGURE WITH OVERRIDE; //reconfigure the change
GO
EXEC sp_configure 'show advanced option' //verify that the advanced options have been enabled
GO
EXEC sp_configure //shows all the advanced options available
GO
EXEC sp_configure 'max worker threads' //shows the current value of max worker threads
GO
EXEC sp_configure 'max worker threads', 3500; //choose the value appropriately 
GO
RECONFIGURE WITH OVERRIDE; //reconfigure the change
GO 
EXEC sp_configure 'max worker threads' //verify that max worker threads reflect the new value
GO
EXEC sp_configure 'show advanced option', '0'; //disable the advanced options
GO
RECONFIGURE WITH OVERRIDE; //reconfigure the change
GO

To See The Current Connections And Current Max Worker Threads.

SELECT
DB_NAME(dbid) as DBName,
COUNT(dbid) as NumberOfConnections,
loginame as LoginName
FROM
sys.sysprocesses
WHERE
dbid > 0
GROUP BY
dbid, loginame

SELECT SUM(current_workers_count) as [Current worker thread] FROM sys.dm_os_schedulers

Do Lots Of Connections Slow Down Your Sql Server? [ Increase MAX Worker Threads ]

I sometimes hear database administrators say, “This database must be involved in our performance problem: it has too many connections.”

Lots of connections might cause a problem for your SQL Server, or it might not. The good news is that there’s a way to clearly tell if they’re dragging down performance or not.

How Can I Prove That Lots Of Connections Are Causing A Performance Problem?

SQL Server can manage a lot of connections without too many issues. Yes, it’s better if an application cleans up its connections over time. We recommend tracking the User Connections performance counter, as patterns in this counter may coincide with other events and be useful information.

But just having a high amount of connections doesn’t prove that was the cause of performance problems. For a smoking gun as to why SQL Server is slow, look in two places:

  • SQL Server Wait Statistics (look for THREADPOOL waits)
  • The SQL Server Error Log (look for the creepy error below)

Threadpool Waits: A Sign Of Trouble

When lots of connections want to run queries at the same time, SQL Server may need to allocate more worker threads. This process can be slow, and at a certain point SQL Server may reach the maximum worker threads allowed for your configuration.

If this happens on your server, when you query your wait statistics since startup.

“New Queries Have Not Been Picked Up By A Worker Thread”: Thread Starvation

When this gets really bad, you may see a nasty error message in your SQL Server Error Log. This message says something like this:

New queries assigned to process on Node 0 have not been picked up by a worker thread in the last 60 seconds. Blocking or long-running queries can contribute to this condition, and may degrade client response time. Use the “max worker threads” configuration option to increase number of allowable threads, or optimize current running queries.

The message neglects to mention a few critical things:

  • Microsoft doesn’t recommend that you change max worker threads, as a general rule
  • The amount of worker threads needed has a lot to do with your parallelism settings (and changing parallelism settings is far more common than the amount of worker threads)
  • Periodic problems like locking and blocking can also drive up worker threads. Raising worker threads might just mask the real root cause of a blocking problem!

What To Do If You Have Threadpool Waits Or Thread Starvation

First, don’t panic. Avoid changing any settings before you know exactly what they’ll do.

Here’s where to start:

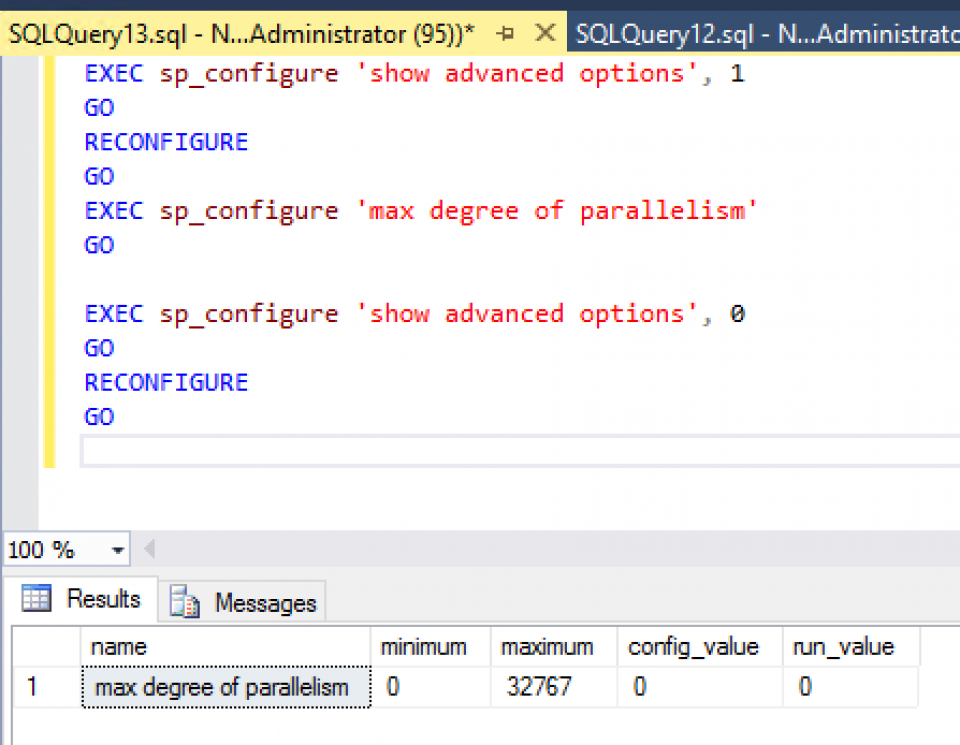
How’s your parallelism? If you have the “max degree of parallelism” setting at the default value of 0 (or a very high number), a good first step is to learn about CXPACKET waits and options for configuring parallelism.

Do you have lock waits? If you have high lock waits (query), consider which tables have the most blocking and how to track down the queries involved.

Have you identified the most frequently run queries in the problem period? Good indexing or improved TSQL for those queries can dramatically reduce needed threads.

What do the perf counters say? Take a look at those performance counters we recommend to see if there’s a jump in the number of connections when the problem occurs or not.

Approaching the problem this way dispels the mystery of whether all those connections really are the problem (or not).

https://blog.mehedy.com/wp-content/uploads/2017/04/image001-960x426_c.png

Max Worker Threads – SQL Server


What Is A Worker Threads In SQL Server?

Worker threads are the agents of SQL Server which are scheduled in CPU and they carry out the tasks. Memory for Worker threads come from Non-Buffer Pool region of SQL Server. – MAX Worker Threads

Purpose Of Max Worker Thread Option

Thread pooling helps optimize performance when large numbers of clients are connected to the server. Usually, a separate operating system thread is created for each query request. However, with hundreds of connections to the server, using one thread per query request can consume large amounts of system resources. The max worker threads option enables SQL Server to create a pool of worker threads to service a larger number of query request,

The max worker threads option configures the number of worker threads that are available to SQL Server processes. The default value for max worker threads is 0. This enables SQL Server to automatically configure the number of worker threads at startup. The default setting is best for most systems. However, depending on your system configuration, setting max worker threads to a specific value sometimes improves performance.

If you leave ‘Max. Worker threads’ to 0 then SQL Server will decide the worker thread count based on formula below:

Max Worker Threads For 32 bit operating system:

Total available logical CPU’s <= 4 : max worker threads = 256

Total available logical CPU’s > 4 : max worker threads = 256 + ((logical CPUS’s – 4) * 8)

Max Worker Threads For 64 bit operating system:

Total available logical CPU’s <= 4 : max worker threads = 512

Total available logical CPU’s > 4 : max worker threads = 512 + ((logical CPUS’s – 4) * 16)


Before You Begin

Limitations and Restrictions

  • When the actual number of query requests is less than the amount set in max worker threads, one thread handles each query request. However, if the actual number of query request exceeds the amount set, SQL Server pools the worker threads so that the next available worker thread can handle the request.

Recommendations

  • This option is an advanced option and should be changed only by an experienced database administrator or certified SQL Server technician.
  • Thread pooling helps optimize performance when large numbers of clients are connected to the server. Usually, a separate operating system thread is created for each query request. However, with hundreds of connections to the server, using one thread per query request can consume large amounts of system resources. The max worker threads option enables SQL Server to create a pool of worker threads to service a larger number of query requests, which improves performance.
  • The following table shows the automatically configured number of max worker threads for various combinations of CPUs and versions of SQL Server.
Number of CPUs32-bit computer64-bit computer
<= 4 processors256512
8 processors288576
16 processors352704
32 processors480960
64 processors7361472
128 processors42244480
256 processors83208576


  • When all worker threads are active with long running queries, SQL Server might appear unresponsive until a worker thread completes and becomes available. Although this is not a defect, it can sometimes be undesirable. If a process appears to be unresponsive and no new queries can be processed, then connect to SQL Server using the dedicated administrator connection (DAC), and kill the process. To prevent this, increase the number of max worker threads.

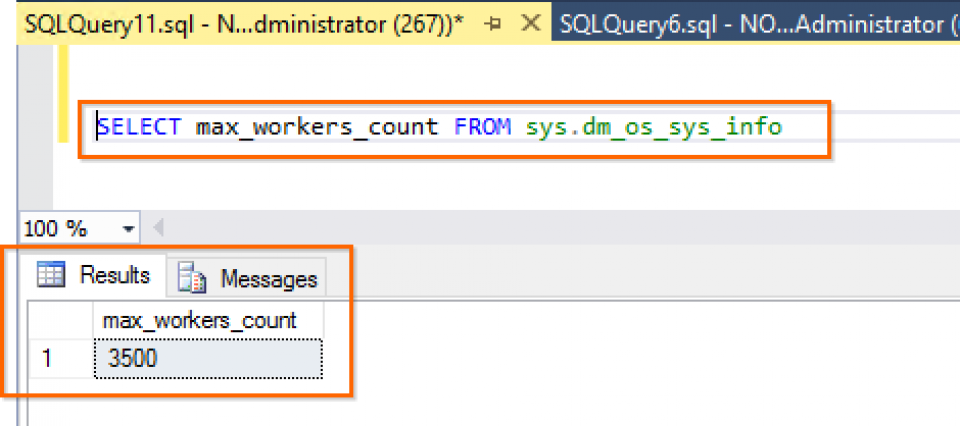
If You Have Set Max. Worker Thread To 0, You Can Check The Worker Thread Count Calculated By Sql Server Using The Query

SELECT max_workers_count FROM sys.dm_os_sys_info

Max Worker Thread

When a request is received, SQL Server will try to locate a idle thread to schedule the request. If an idle worker was not located, new worker will be created. If all workers have been created and none is idle, then the request is queued which will be picked up by any worker thread from the pool of worker threads created.

Query Below Gives The Amount Of Worker Threads Created At The Moment In Your Sql Server:

SELECT SUM(current_workers_count) as [Current worker thread] FROM sys.dm_os_schedulers

Current Worker Thread Query

General recommended to leave Max. worker threads to 0.

Configure Using Sql Server Management Studio

To configure the max worker threads option

  • In Object Explorer, right-click a server and select Properties.
  • Click the Processors node.
  • In the Max worker threads box, type or select a value from 128 through 32767.

Configure Max Worker Threads - Using Sql Server Management Studio

Configure Max Worker Threads - Using Sql Server Management Studio


Use the max worker threads option to configure the number of worker threads available to SQL Server processes. The default setting for max worker threads is best for most systems. However, depending on your system configuration, setting max worker threads to a smaller value sometimes improves performance.

Configure Using Transact-Sql

To configure the max worker threads option

  • Connect to the Database Engine.
  • From the Standard bar, click New Query.
  • Copy and paste the following example into the query window and click Execute. This example shows how to use sp_configure to configure the max worker threads option to 900.

Tsql

USE DATABASE-NAME ;
GO
EXEC sp_configure 'show advanced options', 1;
GO
RECONFIGURE ;
GO
EXEC sp_configure 'max worker threads', 900 ;
GO
RECONFIGURE;
GO


The change will take effect immediately without requiring the Database Engine to restart.

https://blog.mehedy.com/wp-content/uploads/2016/03/oct-2010-wstips-4-through-5-and-san-tip5-fig0-960x668_c.jpg

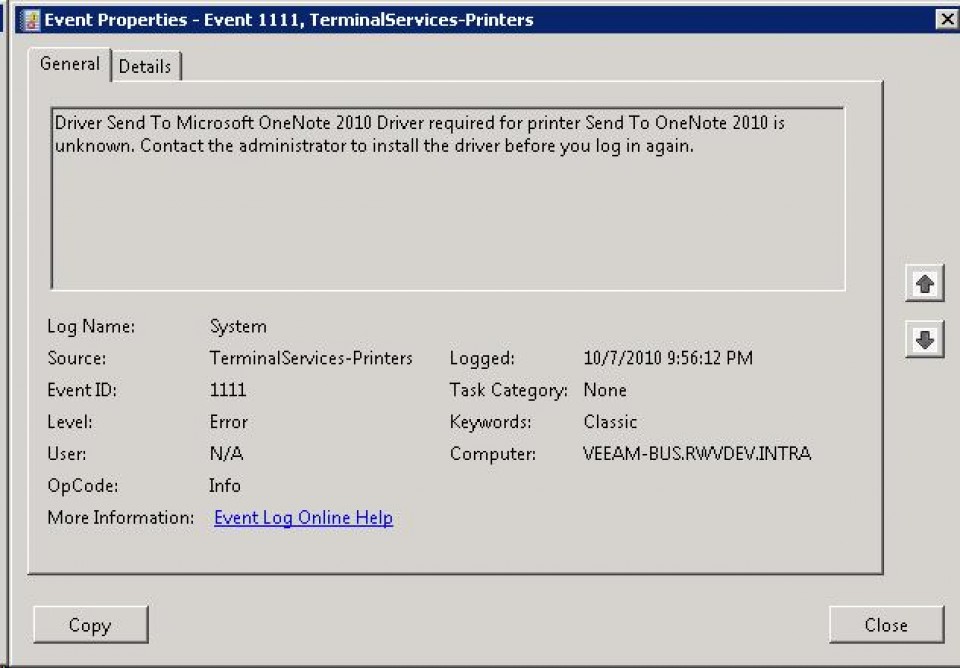
Event ID 1111 — Terminal Services Printer Redirection


You may got a lot of this error in your event viewer let’s fix it simply.

Event ID 1111 is an annoying error message because it’s for a feature that is not used for most Windows Servers. Learn how to disable the printer reduction feature.

Event ID 1111

The simple solution, to disable Printer Redirection form Remote Desktop services,

Remote Desktop Client

or you can disable it from GPO

Disable Printer Redirection - GPO

This GPO is configured in ” Computer Configuration >> Policies >> Administrative Templates >> Windows Components >> Remote Desktop Services >> Remote Desktop Session Host >> Printer Redirection “

Set ” Do not allow client printer redirection ” to ” Enable “.

This setting will override the client settings to redirect the printer setting. After this setting is in place, you’ll no longer see that irritating error message.

For more details Technet.

http://technet.microsoft.com/en-us/library/cc775141%28v=ws.10%29.aspx

https://blog.mehedy.com/wp-content/uploads/2016/03/image2-e1457503841570-960x667_c.png

Fix “106” Performance Counter events on Exchange servers


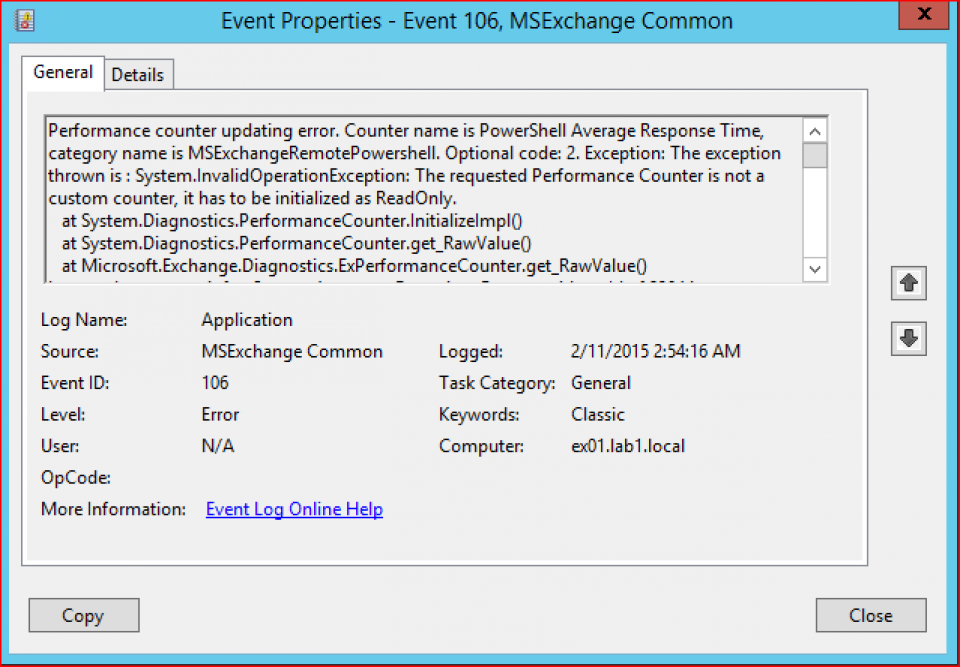
You might have seen lots of errors in the Application log of your Exchange 2013 server from source MSExchange Common and event id 106.

"106" Performance Counter events

Performance counter updating error. Counter name is PowerShell Average Response Time, category name is MSExchangeRemotePowershell. Optional code: 2. Exception: The exception thrown is : System.InvalidOperationException: The requested Performance Counter is not a custom counter, it has to be initialized as ReadOnly.

The issue is caused by an error in the Exchange setup process where a performance counter definition is tried to read from the wrong location.

The good news is that we can fix this very easy. Copy the following script to a text file and save with the .ps1 extension.

Add-PsSnapin Microsoft.Exchange.Management.PowerShell.Setup
$files = Get-ChildItem “c:\Program Files\Microsoft\Exchange Server\V15\setup\perf\*.xml”
Write-Host “Registering the perfmon counters”
Write-Host
$count = 0;
foreach ($i in $files)
{
$count++
$f =  $i.directory, “\”, $i.name -join “”
Write-Host $count $f -BackgroundColor red
New-PerfCounters -DefinitionFileName $f
}

Run the script from an Exchange management shell.

"106" Performance Counter events

If you run into issues you can manually retry the process for that specific performance counter definition. For instance, to retry the failed counter definition from the screenshot above you can retry the action:

Add-PsSnapin Microsoft.Exchange.Management.PowerShell.Setup
New-PerfCounters -DefinitionFileName “C:\Program Files\Microsoft\Exchange Server\V15\setup\perf\WorkerTaskFrameworkPerfCounters.xml”

Interesting detail is that Microsoft apparently wrote a KB article about this issue back in 2013 which I failed to pick up. I modified the script to work on servers with Exchange installed in a non-default path. If you prefer to use the original one, don’t forget to change the path manually.

https://blog.mehedy.com/wp-content/uploads/2016/03/sshot-15-960x315_c.jpg

How to Clear Exchange ActiveMonitoring Trace Logs


Dear friends, today I am going to give you a tip for exchange server. you might have noticed that on exchange server, after installation it generates some trace logs daily, and each logs size is about 250 MB, which consumes your installation drive day by day.

the logs gets created as below location

c:\Program Files\Microsoft\Exchange Server\V15\Logging\Monitoring\Monitoring\ActiveMonitoringTraceLogs

these logs are no use to us, and it consumes our valuable exchange storage. So, How do we get rid of it?

Goto your exchange servers

Open <ExchangeInstallPath>:\bin\MSExchangeHMWorker.exe.config  in a administrative notepad

Find the Line <add key=”IsTraceLoggingEnabled” value=”true” />
and change to false and save.
Reboot server and you can now clear the logs in the monitoring path
and they will not regenerate

If you take you time to look at the bottom of this config file it will say “Used for Exchange Online only” Microsoft have confirmed this has been set to true in error

If you download the tool, Windows Directory Statistics you can see the drive usage like below image.

Windows Directory Statistics

Windows Directory Statistics

Menu